TRC helps producers and end users of clean fuels maximize their revenue potential with Low Carbon Fuel Standard programs and the federal Renewable Fuel Standard (RFS). We do this by evaluating vehicle eligibility and metering, establishing the energy use for eligible equipment, estimate annual revenue from credit sales, registering equipment and facilitating quarterly reporting, and brokering and monetizing your credits.
To learn how you can create additional economic value for your business with low-carbon and carbon-negative fuels, please contact us at funding@act-news.com or click here to visit the TRC website.
Low Carbon Revenue Opportunities
As fleets consider investment in electric vehicles, there is an opportunity for fleet operators to generate new revenue streams through state low carbon fuel programs including California, Oregon, Washington, British Columbia, and Nationally in Canada.
These programs measure the lifecycle carbon intensity of all transportation fuels sold in the state, and then enable businesses to earn financial credits for using fuel with low and negative carbon intensity. The value of these credits varies daily based on the supply of low-carbon intensity fuels in the state, the demand for fossil fuels, as well as other market influences.
Fleets and equipment operators can generate revenue opportunities by selling their credits to regulated entities, such as importers, producers, and refiners of petroleum fuels. By generating and selling these credits, credit owners can reduce their total-cost-of-ownership for the deployment and operation of zero emission technologies.
To learn more about monetizing low-carbon fuel credits or to subscribe to TRC’s Carbon Markets Quarterly e-Newsletter, visit our website.
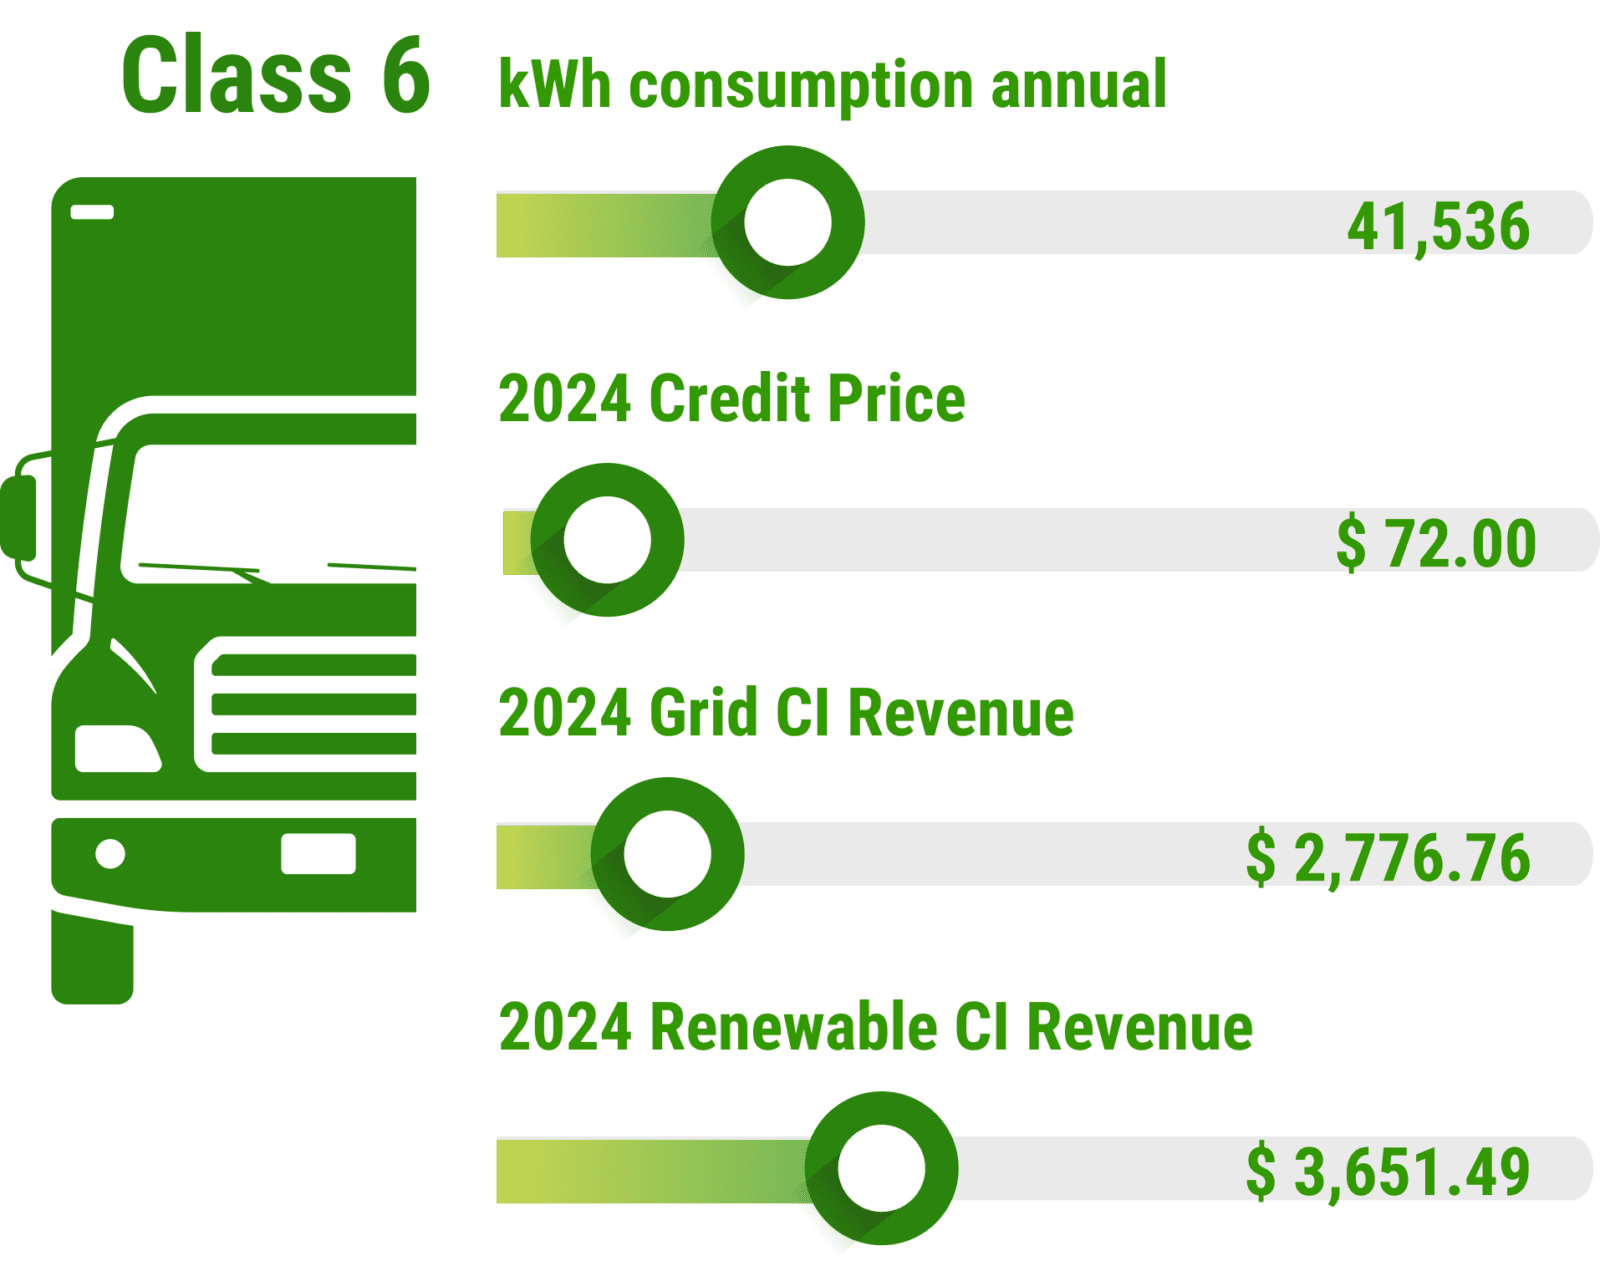
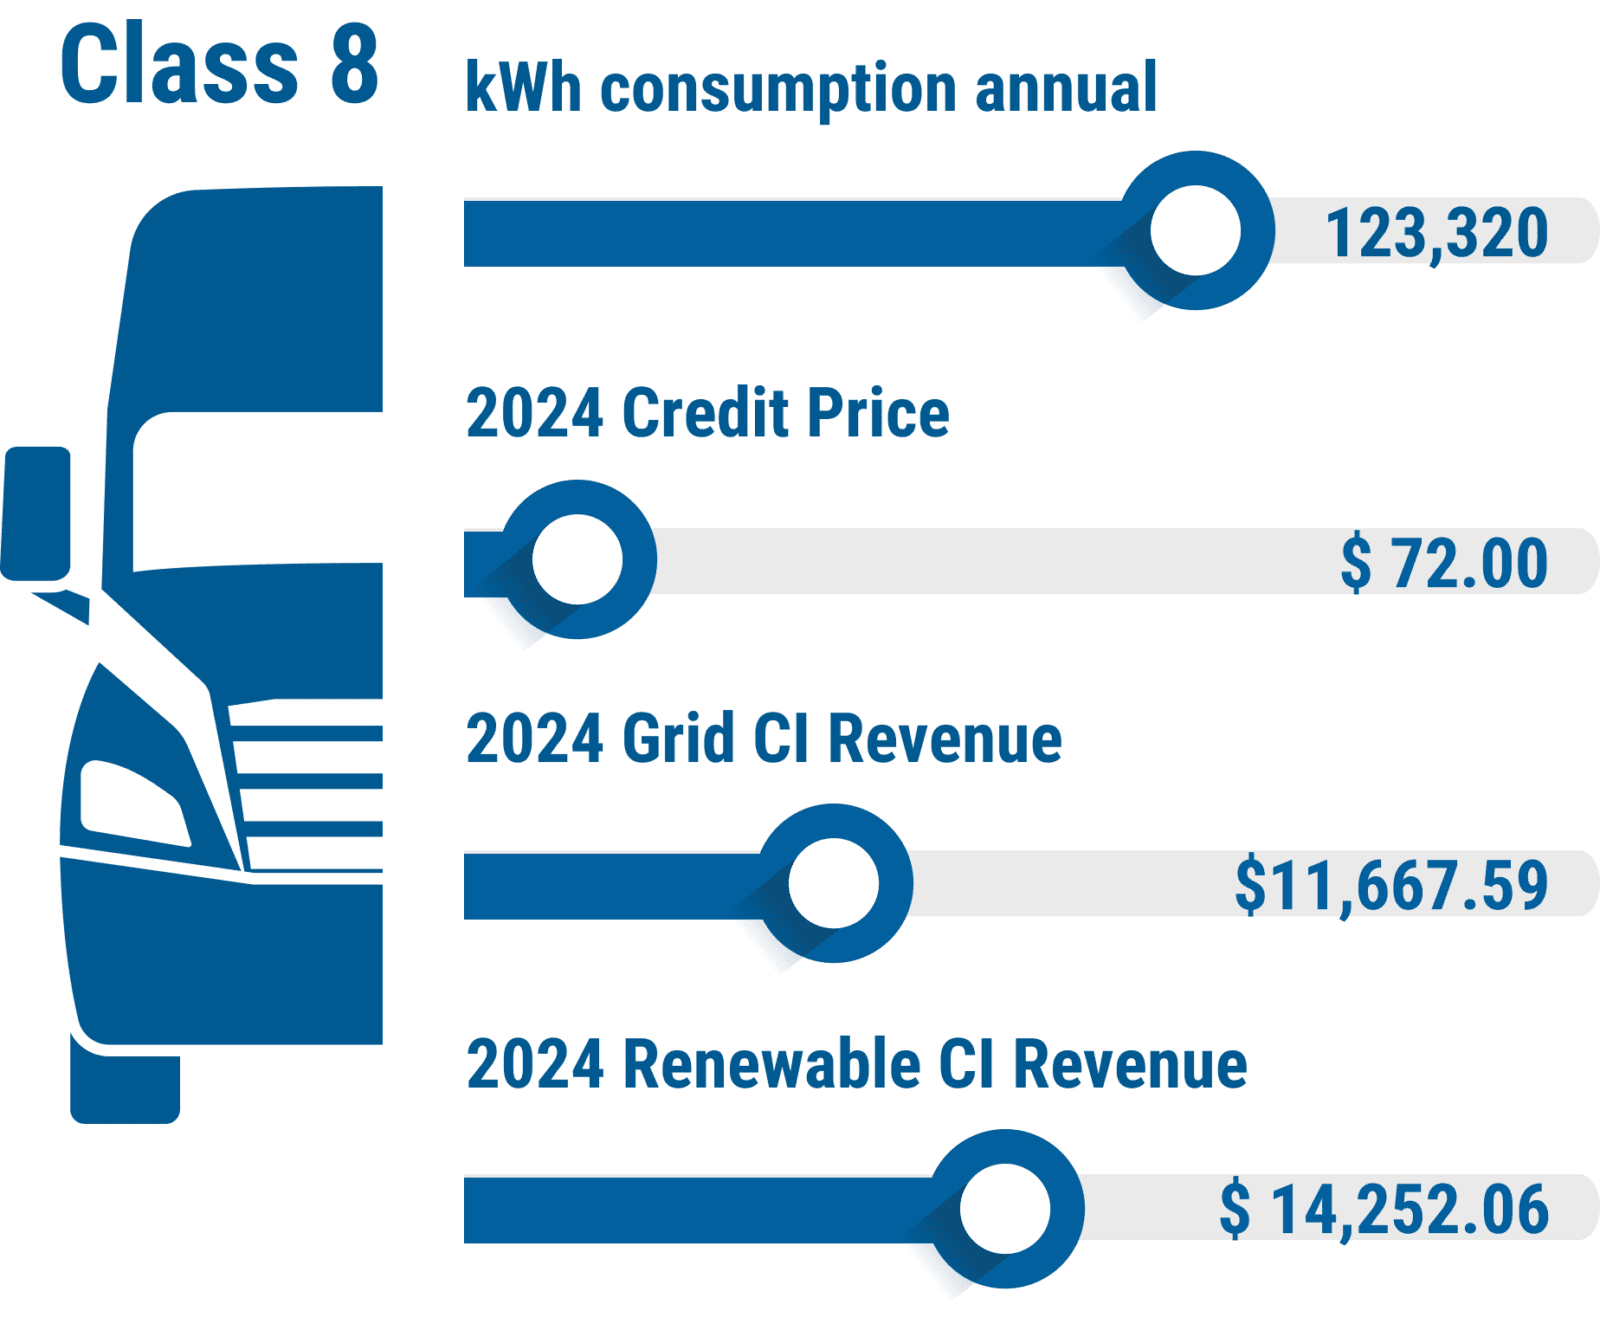
LCFS Revenue Potential
RFS: Save on Renewable Fuel Costs
The Renewable Fuel Standard (RFS) program is a federal program incentivizing production of low carbon biofuels through a renewable volume obligation mandate, requiring obligated parties to obtain sufficient volumes of Renewable Identification Numbers (RINs). Renewable fuel providers can generate credits, called RINs, and sell these credits to obligated parties. Fleet managers that are interested in procuring renewable fuels, such as renewable natural gas (RNG), can negotiate the best possible price for their contracts by staying informed of RIN credit market dynamics.
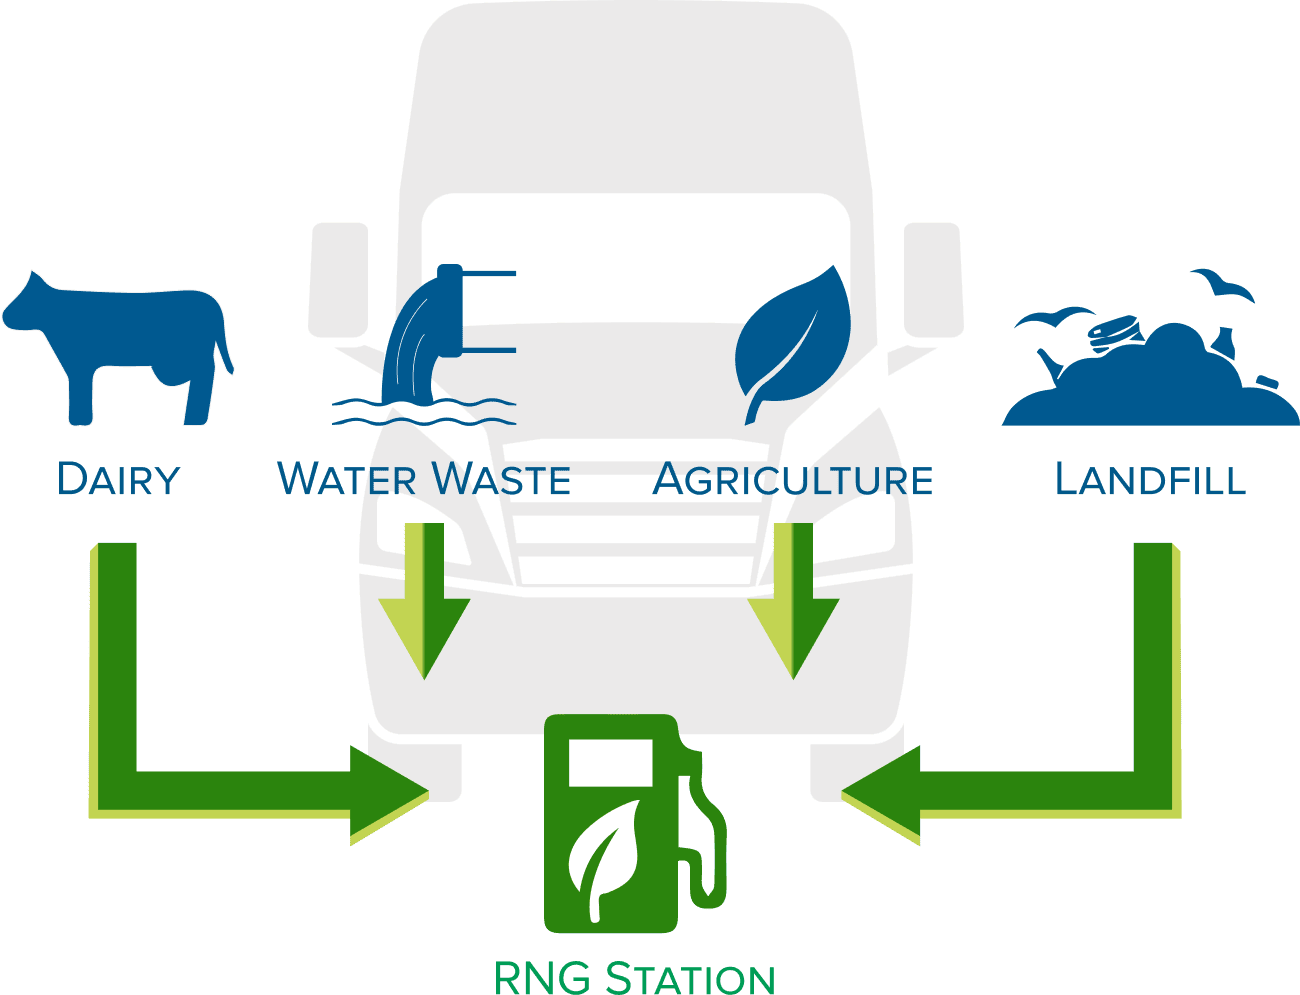
How RNG is Produced